Links, trade and AI: An analysis of the informal knowledge network in Sub-Saharan Africa
Digital and physical connectivity are often framed as catalysts for a prosperous knowledge economy. The rapid adoption of mobile phones and the Internet in Sub-Saharan Africa (SSA) brought excitement for an information revolution that would boost the knowledge economy, connect the region with the rest of the world and provide sustainable, independent growth.
Researchers have been studying the emergence of the knowledge economy and the socio-economic impact of ICT advancements in Africa. The results are not promising. Even though there are over 900 million mobile phone users and 350 million people connected to the Internet, the increased connectivity has not been as transformational as it was thought to be. For example, the Internet did not make digital entrepreneurship in SSA more inclusive. It also still remains spatially clustered, mainly happening in the most populous cities, and confined within the educated population. Furthermore, the creation of digital content, measured by collaborative software development and Internet domain registrations, is geographically uneven within the continent while the gap with the rest of the world is widening. Connectivity could be an important component for the emergence of the knowledge economy in Sub-Saharan Africa but not an enabling factor.
An understudied area is the informal networking activity with tech and business content in Sub-Saharan Africa. In a poster presented at the IC2S2, we investigated its spatial distribution, how the links of local communities correlate with international trade data and how the region’s technologically specialised communities compare to those of the European Union (EU).
Main findings Link to heading
- In all SSA countries but Cameroon, more than half of the Meetup groups are located in the three most populous cities of each country.
- The total value of exports in services correlates with the number of international links and the eigenvector centrality of the SSA countries.
- AI activity in SSA has increased, however, it remains less specialised than the EU.
Data Link to heading
To do this work, we used data from Meetup, a platform for hosting in-person networking events. On Meetup, users can join groups and attend events. Meetup groups are split into categories depending on their topic of interest. We collected all the technology and business groups located in Sub-Saharan Africa and the European Union, the members that have joined them as well as the rest of the groups these members have joined which can be anywhere in the world. Moreover, we used the geographic coordinates of the Meetup groups to find their country and city. We also enriched the data by adding the population of cities in SSA.
Our analysis focuses on groups created between 2010 and 2018 with 41 out of the 46 SSA countries having hosted Meetup events within this timeframe. Overall, we found 1,386 tech and business Meetup groups in SSA and 28,284 in the EU.
Analysis Link to heading
When examining the spatial distribution of Meetup groups, we find that in all countries but Cameroon, more than half of the groups are located in the three most populous cities of each country. For the Meetup members, this holds for all SSA countries [1].
International networking and trade Link to heading
We constructed a global co-membership network to encode how pairs of Meetup groups are connected to one another via shared members [2]. In detail, each unique group was represented as a node and the weighted edge between two nodes showed their Jaccard index. Then, we drew a maximum spanning tree to reduce the network’s density by keeping only the edges with the largest weight. In this way, a country was connected with another one only if they shared the largest number of Meetup members [3]. Lastly, we ran a community detection algorithm and identified six clusters of nodes.
By examining the graph of Figure 1, we find that South Africa’s Meetup groups are the most connected in Sub-Saharan Africa, followed by Kenya’s and Nigeria’s. The United States is the biggest international hub, while countries in western Africa are mostly connected to France.
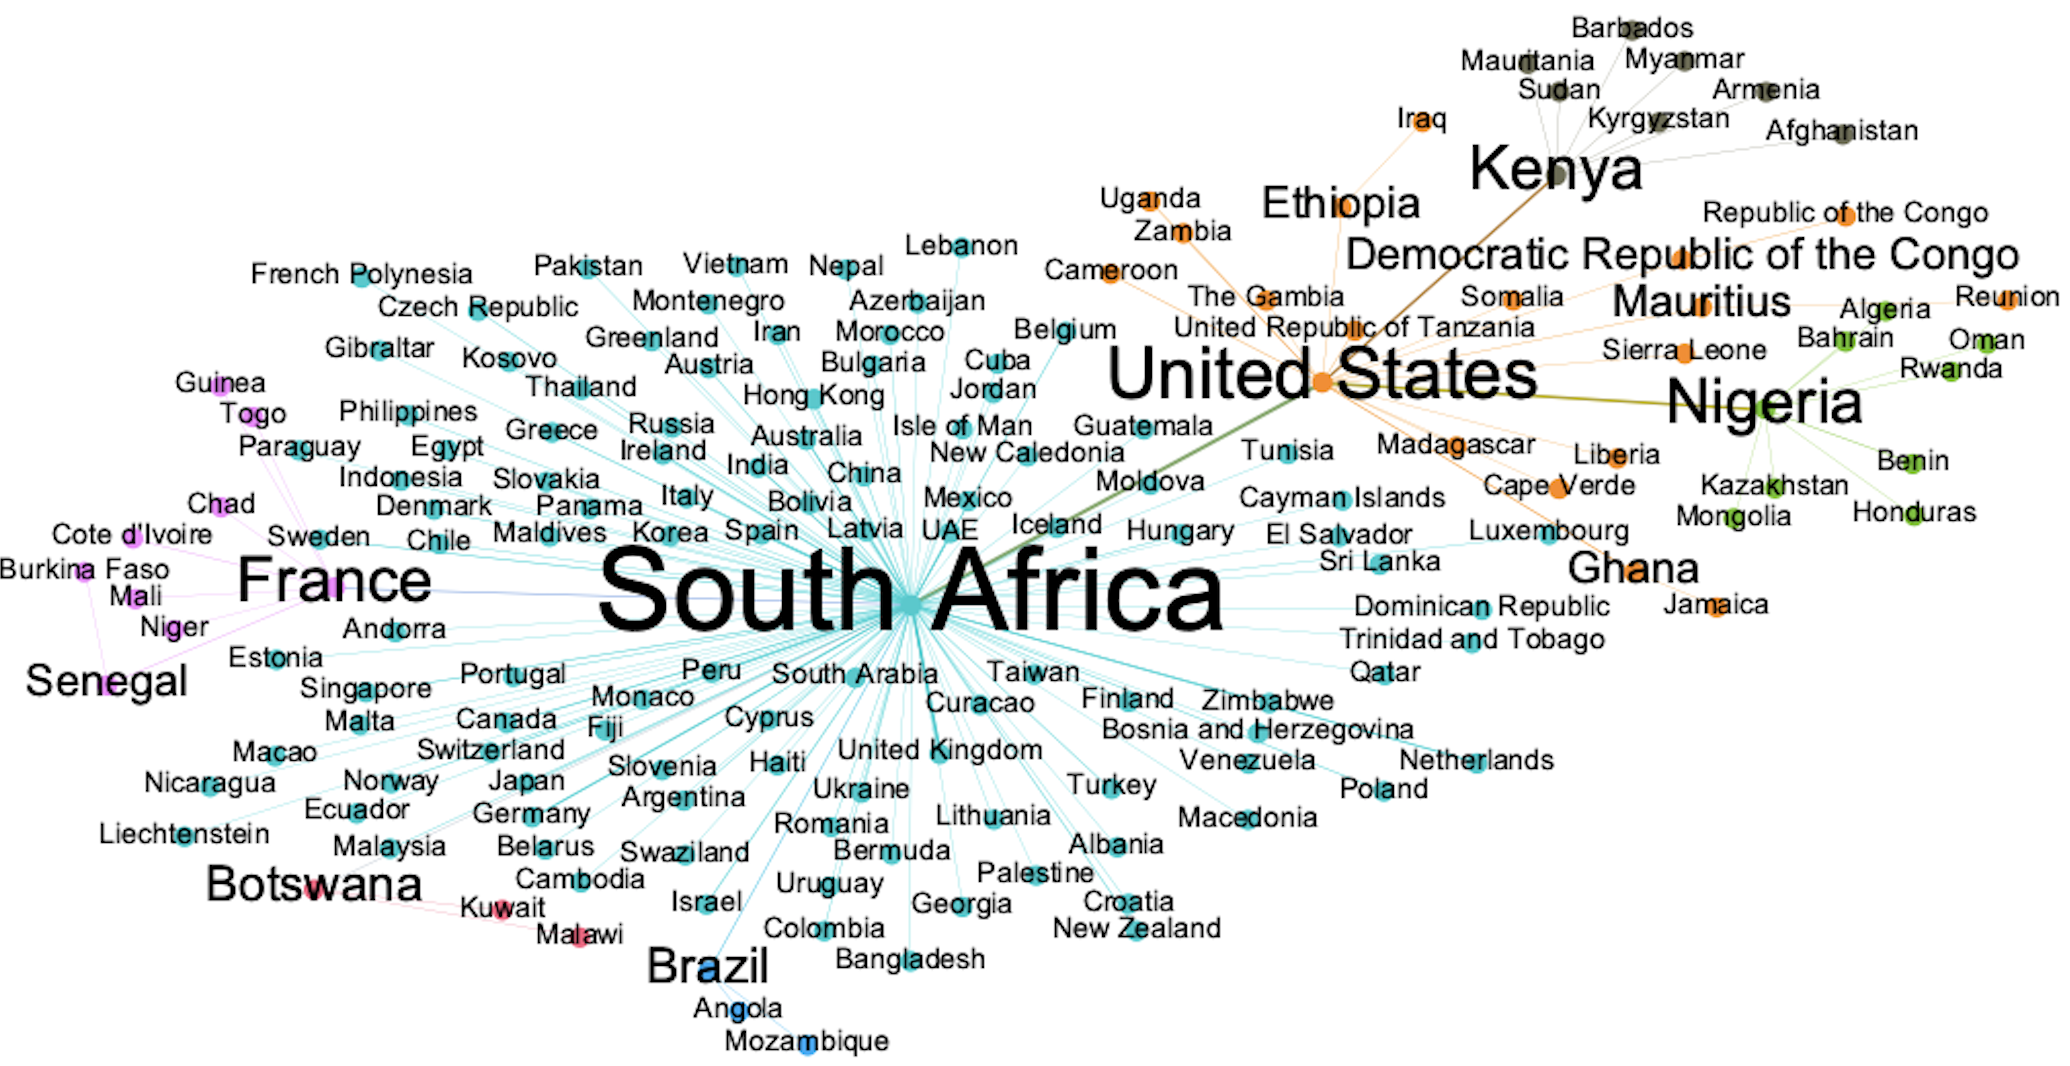
Figure 1. Links between SSA’s Meetup communities and the rest of the world
Then, we examined the correlation between the value of trade in services of the SSA countries with their number of connections and their eigenvector centrality. As Figure 2 shows, we find a strong and statistically important correlation between the volume of exports in services with the degree count and the eigenvector centrality of an SSA country [4].
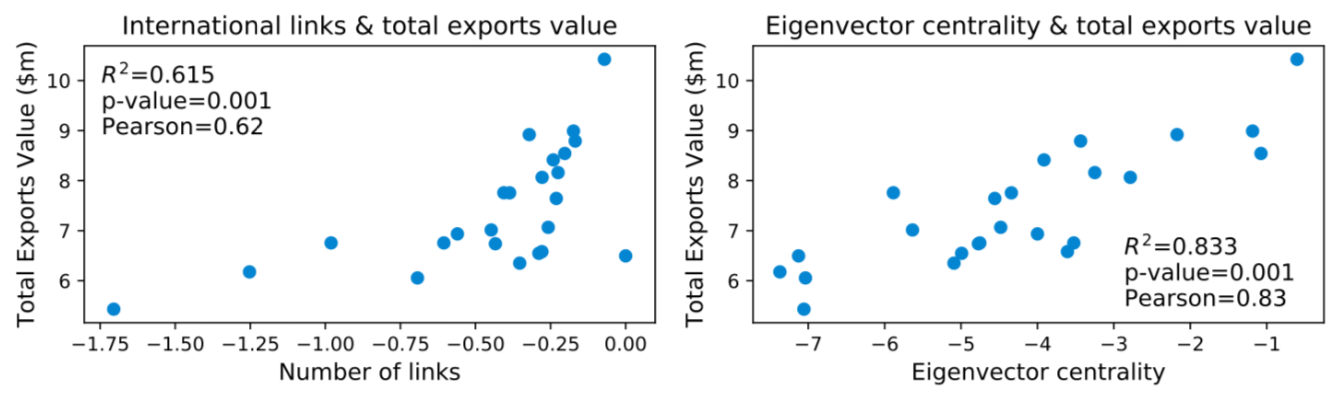
Figure 2. The more connected a Sub-Saharan Africa country is or the more linked to “rich” neighbours (nodes with a high degree count), the larger its total value of exports in services.
Artificial Intelligence in Sub-Saharan Africa and the EU Link to heading
Meetup groups use keywords that describe their topics of interest. In our analysis, we used these keywords to identify Artificial Intelligence (AI) Meetup groups and study the differences between those in SSA and the EU.
Spotting the AI clusters Link to heading
We treated the keywords of every group as an artificial sentence and trained a word2vec model, finding the vector representation of every keyword [5]. For example, the ‘machine-learning, data-analytics, data-mining’ is a sentence with three tokens, ‘machine-learning’, ‘data-analytics’ and ‘data-mining’.
Then, we used t-SNE to reduce the dimensionality of the vector space to 2D. Lastly, we fitted a Gaussian Mixture model to cluster the word vectors and handpicked the clusters that contained numerous AI-related keywords. Using this pipeline, we identified 301 AI Meetups in SSA and 6,145 in the EU.
AI is not everywhere the same Link to heading
We constructed a co-occurrence network of the AI keywords used in SSA and the EU and drew its maximum spanning tree, as in the previous section, to examine if the interests of the communities of these areas differ. Figure 3 shows the AI and Big Data network where all of the keywords (blue and orange) have been used by EU Meetup groups while those in orange have not been used by SSA Meetups. Even though there is a significant overlap, there are some noticeable differences. For example, keywords related to GPU programming, signal processing and autonomous vehicles have not been used by SSA Meetup groups.
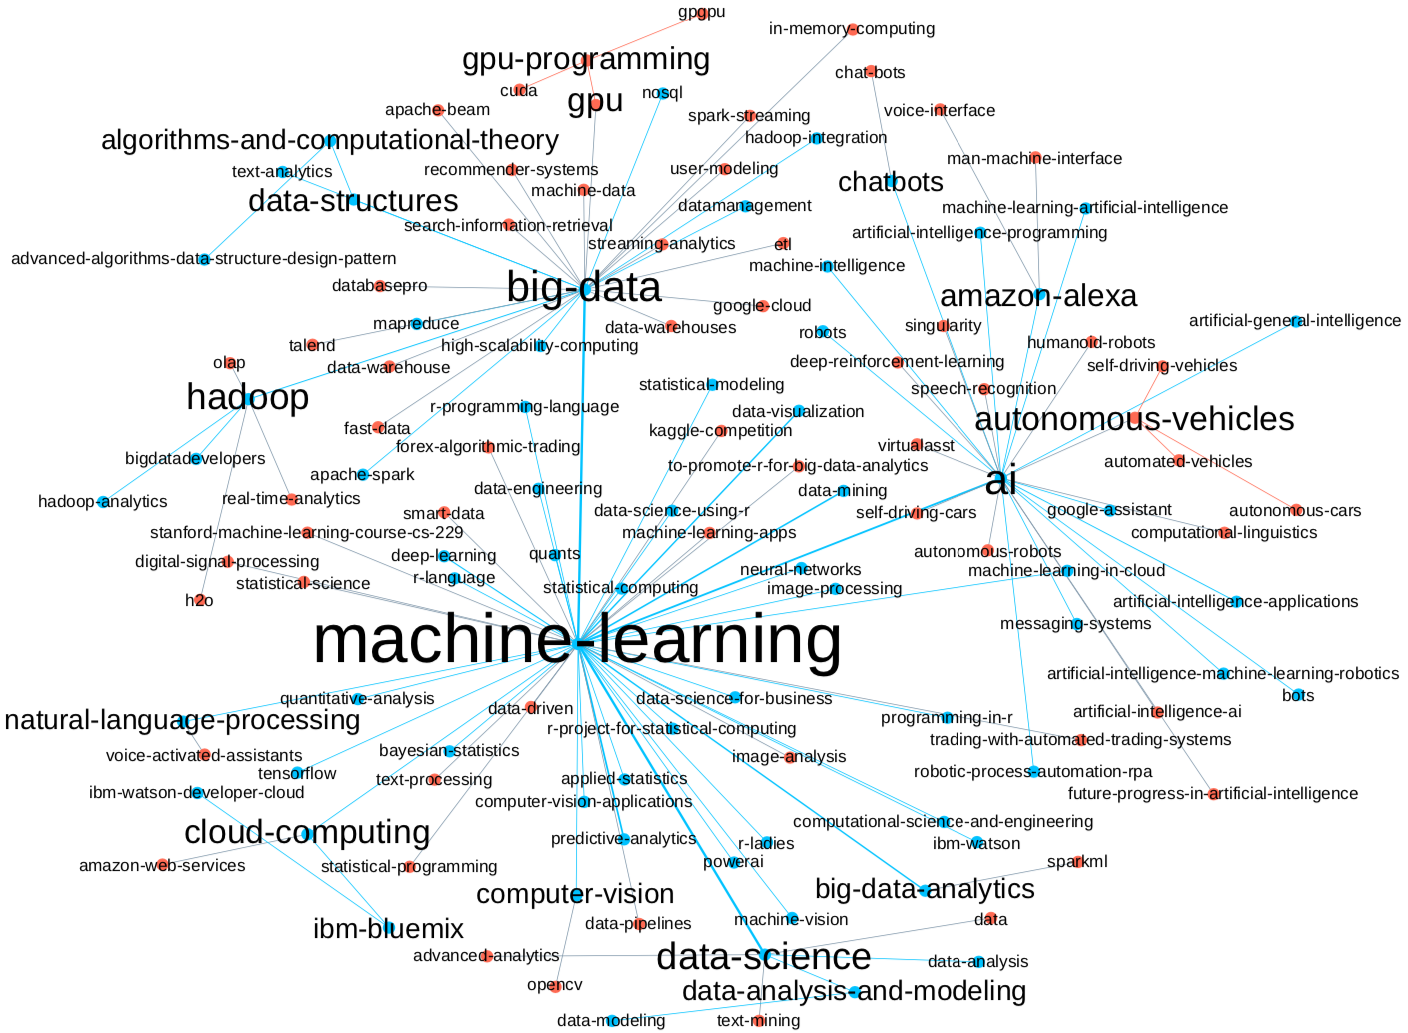
Figure 3. AI and Big Data keywords graph.
Lastly, we examined how AI is represented in SSA and the EU. Using only the AI Meetups, we found the proportion of SSA and EU groups that have used some of the most common AI keywords [6]. We subtracted the continent proportions and show the differences for AI keywords in Figure 4. We find that more specialised keywords such as deep learning and neural networks are overrepresented in EU’s communities, while more generic keywords such as cloud computing, data visualisation and machine learning are overrepresented in SSA.
Even though SSA’s AI Meetup activity has rapidly increased in recent years, it remains less specialised than the EU’s.

Figure 4. Overrepresentation of AI Meetup tags in the EU and SSA.
Next steps Link to heading
- Use Meetup event data to understand how the interests of individuals in SSA change over time.
- Combine Meetup with flight data to examine the link between the ease of transportation and the connectivity of Meetup communities. In a similar fashion, associate data from CEPII with Meetup.
- Examine if Meetup data could be used to nowcast SDG indicators.
Notes Link to heading
- We assigned Meetup members to the cities where they had joined the most groups.
- Since we are interested in showing how the informal network communities of Sub-Saharan Africa countries are connected to the rest of the world, we restricted our network to pairs where at least of the countries is from that region.
- Michele Coscia has written an interesting paper on Network Backboning with Noisy Data. It could be used to reduce the number of edges in the graph.
- The analysis was done with the original co-membership network and not with the maximum spanning tree.
- Word2vec creates word vectors in a way that those found in a similar context will have also have a similar vector representation.
- We ran a two proportion z-test to determine the significance of our results. In Figure 4, the difference in all of the keywords but data-engineering, data-science, tensorflow and machine-intellingence was statistically significant.